Basic Heightmap Generation and Visualisation with HTML Canvas
Recently, I delved into game map generation with the goal of finding a simple method to create functional battle maps featuring varying elevations. Since these maps are intended for tactical engagements, we’ll focus on a zoomed-in view and aim to minimise random height variations. So, today, we’ll explore a basic map generation process that utilises a predefined biome to create such a heightmap.
For this project, I chose Next.js and TypeScript due to their versatility and ease of use. However, the underlying principles are easily transferable to other languages and frameworks—I successfully replicated the process using both C# and Python, for example.
Map generation for games or simulations typically involves constructing a grid or array of tiles, each representing different types of terrain. Each tile usually has a “height” value that determines its elevation, and the distribution of these heights shapes the map’s topography. In our web application, this heightmap will be visualised using the HTML Canvas, providing an interactive and dynamic representation of the battle map.
Biomes and Heightmaps
A biome is a distinct region characterised by specific terrain features and environmental conditions. For our purposes, we focus on five major types of biomes: aquatic, grasslands, forests, deserts, and tundra. While there are more complex classifications of biomes, this simplified categorisation is sufficient for our map generation task.
Our basic heightmap generator uses each biome type to influence the heightmap, which is a grid of values representing the land’s elevation. For example, aquatic biomes are designed with lower elevation values to depict underwater areas, creating more realistic bodies of water. In contrast, mountainous biomes incorporate a broader range of elevations, allowing for the formation of valleys and peaks that add depth and variation to the landscape.
In TypeScript, we can define the available biomes using a union of string literals:
export type Biome = 'aquatic' | 'grassland' | 'forest' | 'desert' | 'tundra';Additionally, we define a HeightmapTile interface that contains the height value for each tile on the map:
export interface HeightmapTile {
  height: number;
}
Generating a Heightmap Based on a Biome
Creating a heightmap involves generating a two-dimensional array of HeightmapTile objects, where each tile’s height is influenced by the selected biome. In this implementation, a height of 0 represents sea level. Any tile with a height below this threshold is considered underwater, effectively simulating water bodies within aquatic biomes. (While the current focus is on colouring water areas within the aquatic biome, the detailed rendering of features like rivers and lakes in other biomes will be addressed in future enhancements.)
Here is an example of a heightmap generator function based on the selected biome:
export const generateHeightmapFromBiome = (cols: number, rows: number, biome?: Biome): HeightmapTile[][] => {
  // Initialize a 2D array to hold the heightmap tiles
  let heightmap: HeightmapTile[][] = [];

  // Loop through each row of the heightmap
  for (let y = 0; y < rows; y++) {
    // Initialize an array to hold the height tiles for the current row
    const row: HeightmapTile[] = [];

    // Loop through each column of the current row
    for (let x = 0; x < cols; x++) {
      let height = 0; // Initialize the height variable

      // Determine the height value based on the specified biome
      switch (biome) {
        case 'aquatic':
          height = Math.random() * 300 - 200; // range [-200, 100]
          break;
        case 'grassland':
          height = Math.random() * 125 - 50;  // range [-50, 75]
          break;
        case 'forest':
          height = Math.random() * 300;       // range [0, 300]
          break;
        case 'desert':
          height = Math.random() * 450 - 50;  // range [-50, 400]
          break;
        case 'tundra':
          height = Math.random() * 600 - 100; // range [-100, 500]
          break;
        default:
          height = Math.random() * 1200 - 100; // range [-100, 1100]
          break;
      }

      // Push the created height tile into the current row
      row.push({ height });
    }

    // Add the completed row to the heightmap
    heightmap.push(row);
  }

  return heightmap;
};
Smoothing the Heightmap
Raw heightmaps generated with random values often result in jagged or unrealistic terrain. For example, using the random generator as-is for the aquatic biome produces uneven and unnatural landscapes:
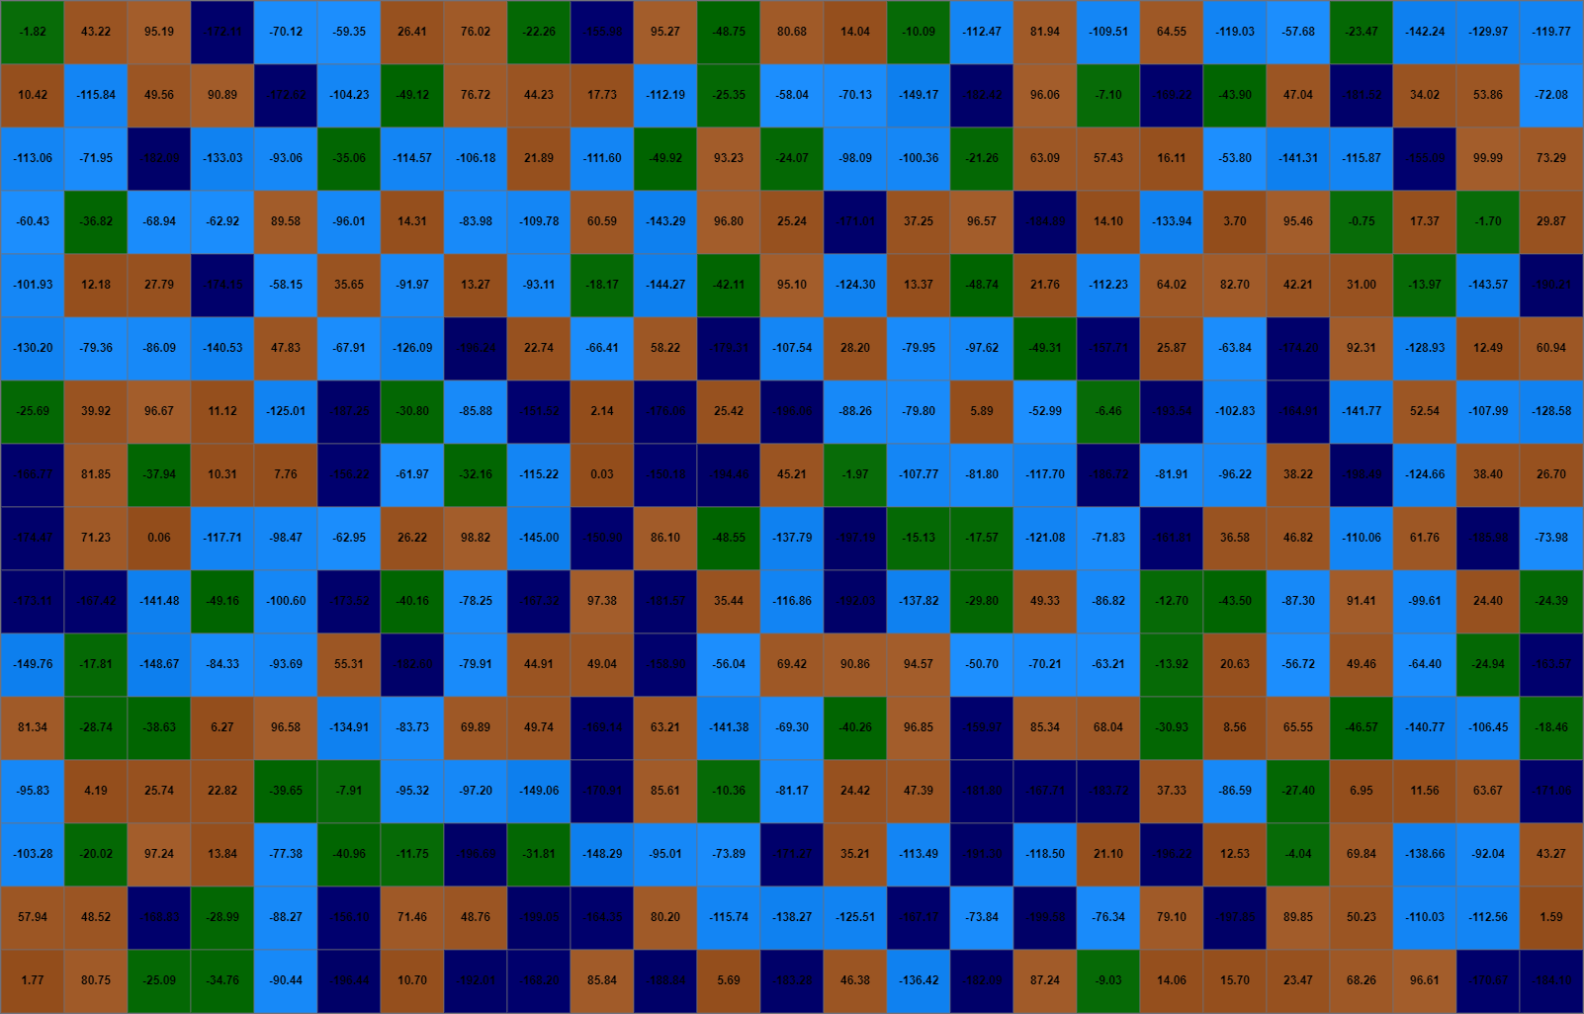
To address this, we apply a smoothing algorithm that averages the height of each tile with its neighbours. This technique creates more gradual transitions between tiles, resulting in a more natural and cohesive landscape.
Below is the function used to smooth the heightmap:
export const smoothHeightmap = (heightmap: HeightmapTile[][]): HeightmapTile[][] => {
  // Get the number of rows in the heightmap
  const rows = heightmap.length;
  // Get the number of columns in the heightmap
  const cols = heightmap[0].length;

  // Initialize a new 2D array to store the smoothed heightmap
  const smoothedHeightmap: HeightmapTile[][] = [];

  // Loop through each row of the heightmap
  for (let y = 0; y < rows; y++) {
    // Initialize an array to hold the smoothed tiles for the current row
    const row: HeightmapTile[] = [];

    // Loop through each column of the current row
    for (let x = 0; x < cols; x++) {
      // Retrieve the heights of the neighboring tiles
      const neighbors = getNeighbors(heightmap, x, y);

      // Calculate the total height by summing the heights of neighbors and the current tile
      const totalHeight = neighbors.reduce((acc, h) => acc + h, heightmap[y][x].height);

      // Calculate the average height, including the current tile in the count
      const averageHeight = totalHeight / (neighbors.length + 1);

      // Push a new tile with the averaged height into the current row
      row.push({ height: averageHeight });
    }

    // Add the smoothed row to the smoothed heightmap
    smoothedHeightmap.push(row);
  }

  return smoothedHeightmap;
};
This function iterates through each tile in the heightmap and calculates the average height based on the heights of its surrounding neighbours. After one pass of using smoothHeightmap, the heightmap appears smoother:
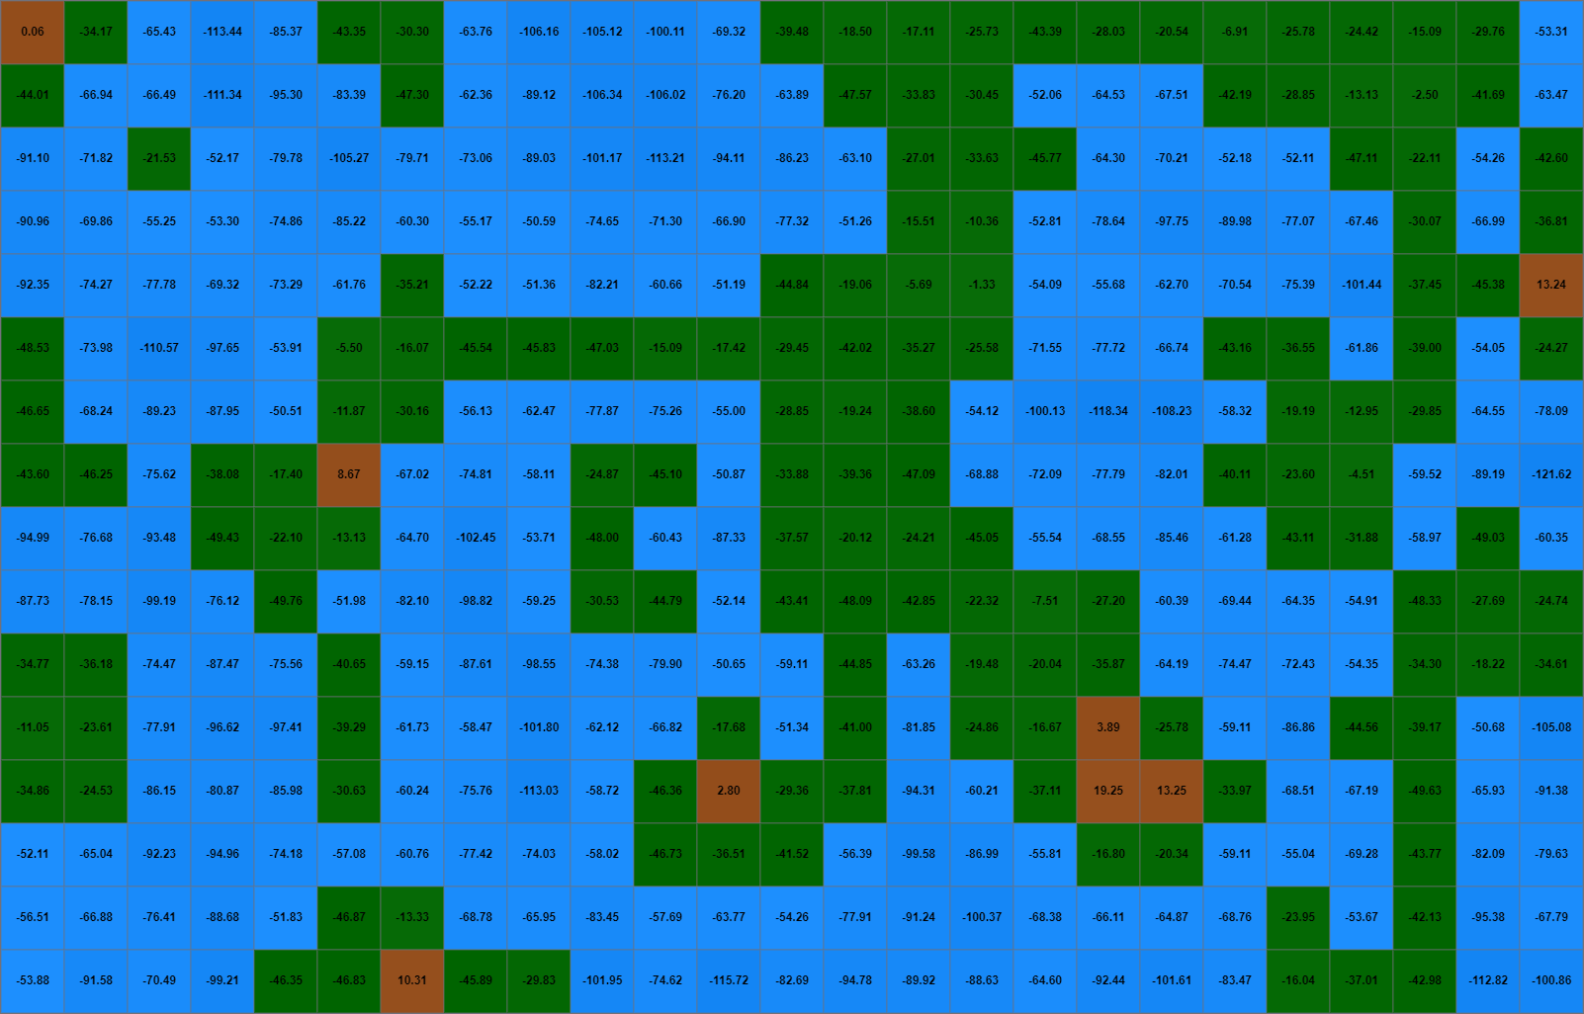
By applying the smoothing process multiple times, the heightmap becomes increasingly continuous and less jagged. For instance, after two passes, the terrain becomes significantly more refined:
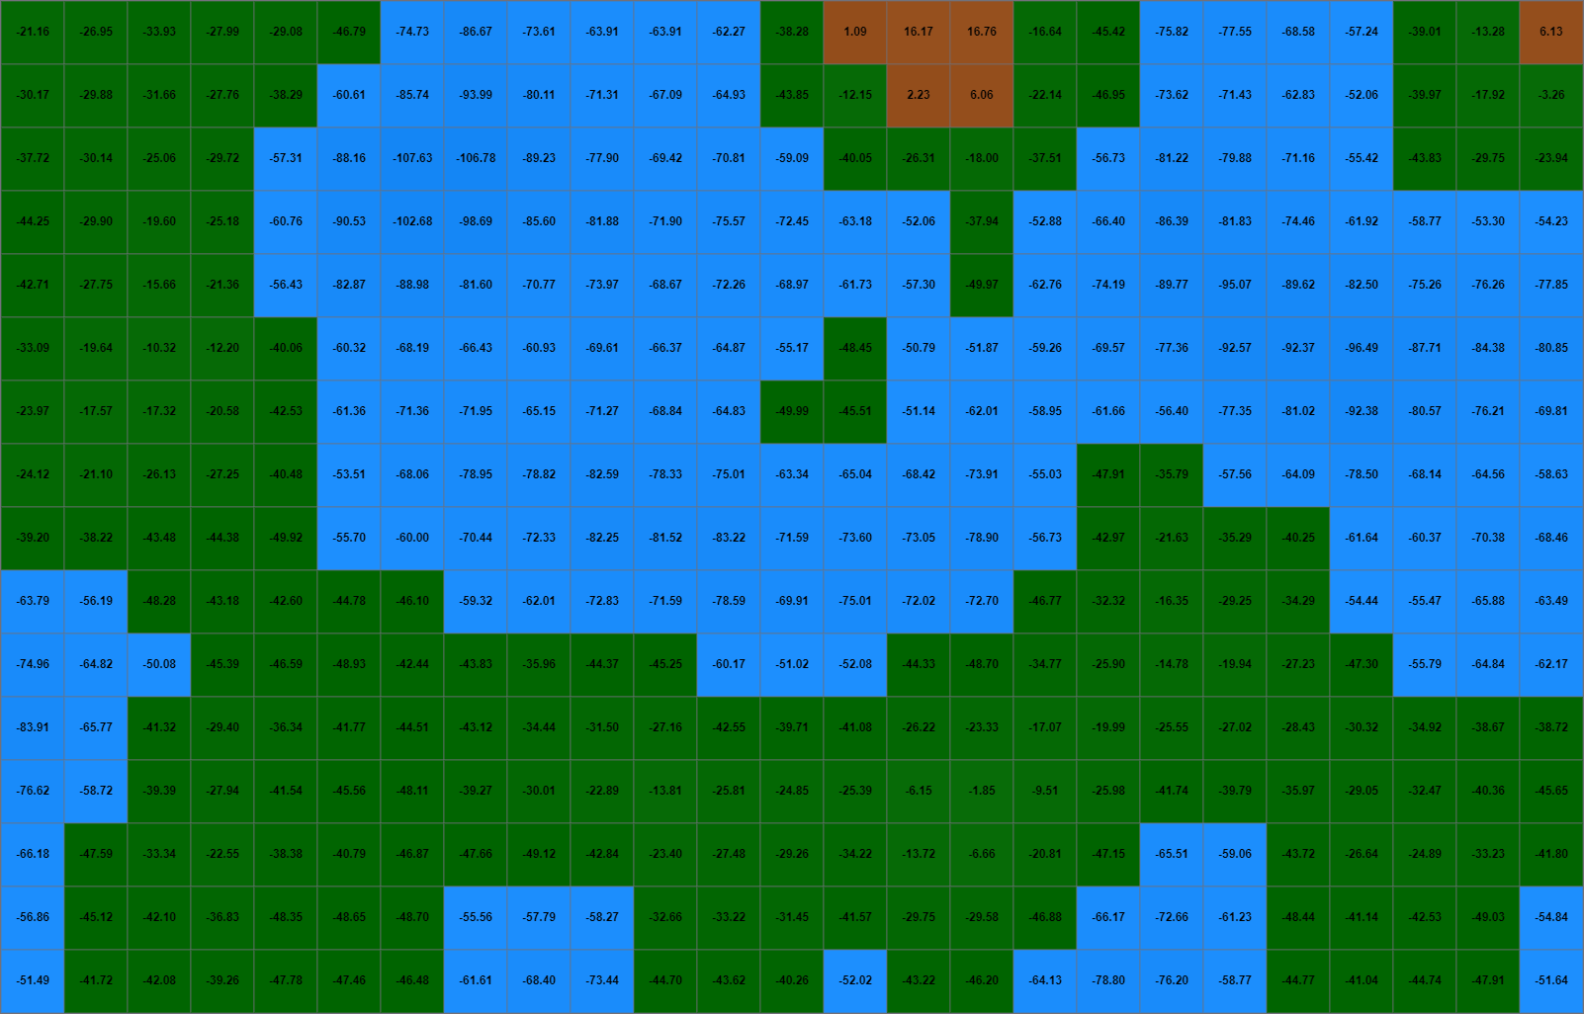
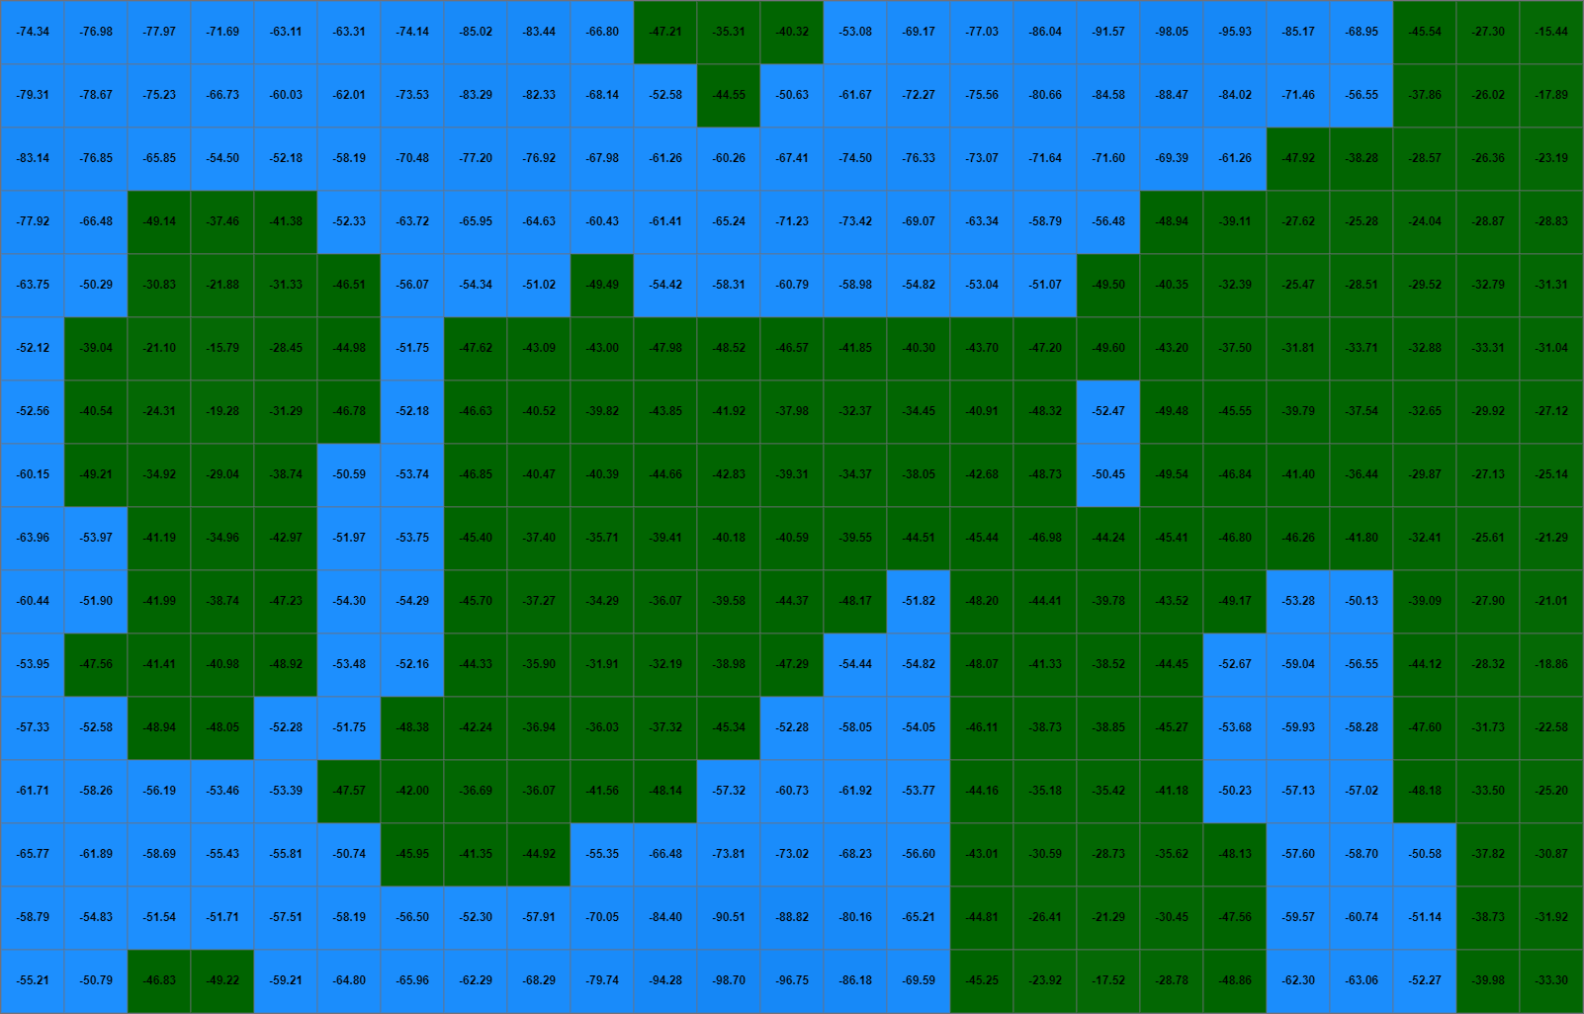
And even moreso after three:
Neighbour Calculation
The getNeighbors function plays a crucial role in retrieving the heights of adjacent tiles while ensuring that only valid neighbours within the map boundaries are considered:
const getNeighbors = (heightmap: HeightmapTile[][], x: number, y: number): number[] => {
  // Initialize an array to hold the neighbor height values
  const neighbors: number[] = [];

  // Define the possible directions to check for neighbors (horizontal, vertical, and diagonal)
  const directions = [
    [-1, 0], // Left
    [1, 0],  // Right
    [0, -1], // Up
    [0, 1],  // Down
    [-1, -1], // Top-left
    [1, 1],   // Bottom-right
    [-1, 1],  // Top-right
    [1, -1],  // Bottom-left
  ];

  // Iterate over each direction to find neighboring tiles
  directions.forEach(([dx, dy]) => {
    const newX = x + dx; // Calculate the new x coordinate based on the direction
    const newY = y + dy; // Calculate the new y coordinate based on the direction

    // Check if the new coordinates are within the bounds of the heightmap
    if (newX >= 0 && newX < heightmap[0].length && newY >= 0 && newY < heightmap.length) {
      // If within bounds, push the height of the neighboring tile to the neighbors array
      neighbors.push(heightmap[newY][newX].height);
    }
  });

  return neighbors;
};
This function calculates the coordinates of each neighbouring tile relative to the current tile at position (x, y). It ensures that the coordinates do not exceed the boundaries of the heightmap, thereby preventing potential errors. Each valid neighbour’s height is added to the neighbors array, which is then used in the smoothing algorithm.
A Complete Heightmap
By combining the heightmap generation and smoothing functions, we can create biome-specific heightmaps that result in more realistic terrain. The map generation process begins by generating the initial height values based on the selected biome. Subsequently, multiple rounds of smoothing are applied to refine the terrain, achieving a more polished and natural appearance.
const cols = 100;  // Width of the map in tiles
const rows = 100;  // Height of the map in tiles
const biome: Biome = 'forest'; // Setting the biome to 'forest'

// Generate the initial heightmap based on the specified biome, width, and height
let heightmap = generateHeightmapFromBiome(cols, rows, biome);

// Smooth the heightmap to create more natural transitions
// Repeat the smoothing process three times to enhance the effect
for (let i = 0; i < 3; i++) {
  heightmap = smoothHeightmap(heightmap);
}
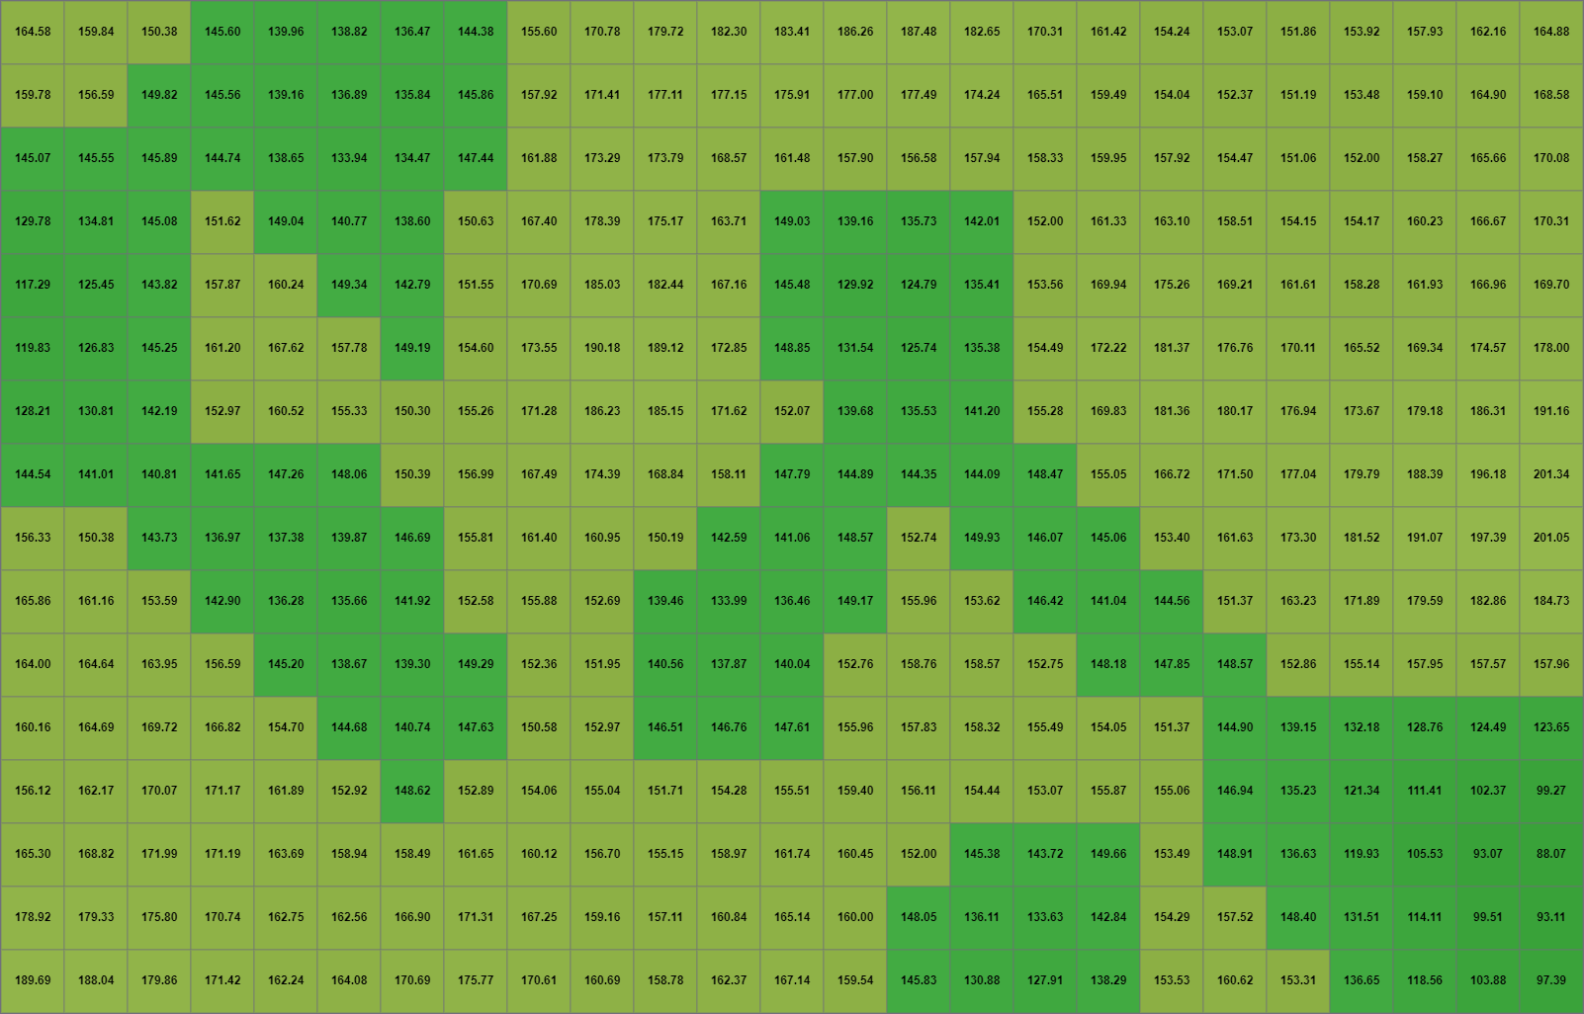
In the example below, we generate a heightmap for the forest biome:
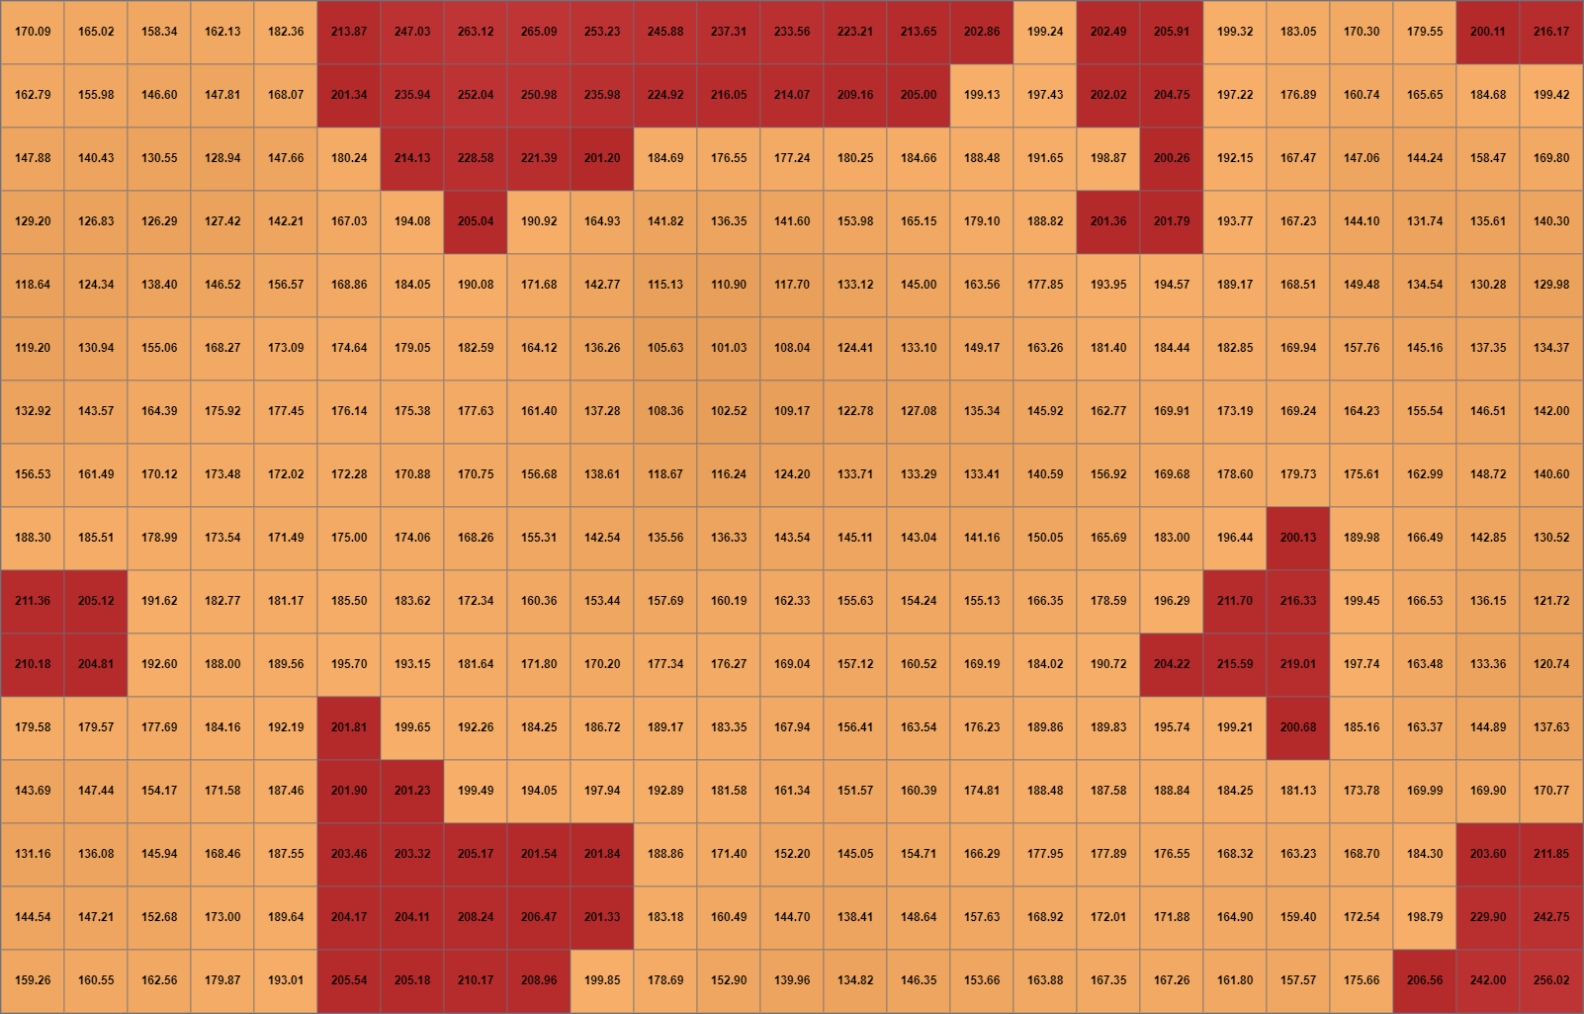
Similarly, generating a heightmap for the desert biome yields a different elevation profile:
Rendering the Heightmap on an HTML Canvas
With the heightmap generated to reflect biome-specific terrain and smoothed for realism, the next step is to visualise this data. Utilising an HTML Canvas provides an efficient way to render the 2D map, allowing each tile to be drawn based on its height value.
Setting Up the Component
First, we create a component that includes a canvas element, which will serve as the drawing area for the map. Below is the definition of the MapCanvas component:
interface MapCanvasProps {
  heightmap: HeightmapTile[][]; // A 2D array representing the heightmap tiles
  tileSize: number; // The size of each tile in pixels
}

const MapCanvas = ({ heightmap, tileSize }: MapCanvasProps) => {
  // Create a ref to access the canvas element
  const canvasRef = useRef<HTMLCanvasElement>(null);

  // useEffect to draw the heightmap when the component mounts or when heightmap/tileSize changes
  useEffect(() => {
    const canvas = canvasRef.current; // Get the current canvas reference
    if (canvas) { // Check if the canvas is available
      const ctx = canvas.getContext('2d'); // Get the 2D rendering context
      if (ctx) { // Ensure the context is available
        drawHeightmap(ctx, heightmap, tileSize); // Call the function to draw the heightmap
      }
    }
  }, [heightmap, tileSize]);

  return (
    <canvas
      ref={canvasRef}
      // Set the width based on the number of columns in the heightmap multiplied by tileSize
      width={heightmap[0].length * tileSize}
      // Set the height based on the number of rows in the heightmap multiplied by tileSize
      height={heightmap.length * tileSize}
    />
  );
};

export default MapCanvas;
Drawing the Heightmap on the Canvas
With the MapCanvas component in place, we need to define the drawHeightmap function, which will render the heightmap data onto the canvas. Each tile’s height determines its colour, visually representing the terrain.
const drawHeightmap = (ctx: CanvasRenderingContext2D, heightmap: HeightmapTile[][], tileSize: number) => {
  // Loop through each row of the heightmap
  for (let y = 0; y < heightmap.length; y++) {
    // Loop through each column of the current row
    for (let x = 0; x < heightmap[y].length; x++) {
      const tile = heightmap[y][x]; // Get the current tile from the heightmap
      const color = getColorForHeight(tile.height); // Determine the color for the tile based on its height

      ctx.fillStyle = color; // Set the fill color for the current tile
      // Draw a filled rectangle representing the tile on the canvas
      ctx.fillRect(x * tileSize, y * tileSize, tileSize, tileSize);
    }
  }
};
Defining the Colour Scheme
To effectively visualise different elevations, we define a colour scheme that maps height values to specific colours. Lower heights might represent water, while higher elevations depict various landforms. Mechanically speaking, these colours serve only as visual indicators for the viewer; within this scope, that functionality is sufficient.
const getColorForHeight = (height: number): string => {
  if (height < -100) {
    return '#0000ff'; // Deep water (blue)
  } else if (height < 0) {
    return '#0099ff'; // Shallow water (light blue)
  } else if (height < 100) {
    return '#00cc66'; // Lowland (green)
  } else if (height < 300) {
    return '#cc9966'; // Hills (brown)
  } else if (height < 500) {
    return '#666666'; // Mountains (grey)
  } else {
    return '#ffffff'; // Snowcaps (white)
  }
};
Using the MapCanvas Component
Finally, we integrate the MapCanvas component into our main application. This involves generating the heightmap based on a selected biome and specifying the tile size for rendering.
const MapApp = () => {
  const cols = 100;
  const rows = 100;
  const biome: Biome = 'forest';
  const tileSize = 5; // Set the size of each tile in pixels

  const heightmap = generateHeightmapFromBiome(cols, rows, biome);

  return (
    <div>
      <h1>Biome: {biome}</h1>
      <MapCanvas heightmap={heightmap} tileSize={tileSize} />
    </div>
  );
};

export default MapApp;
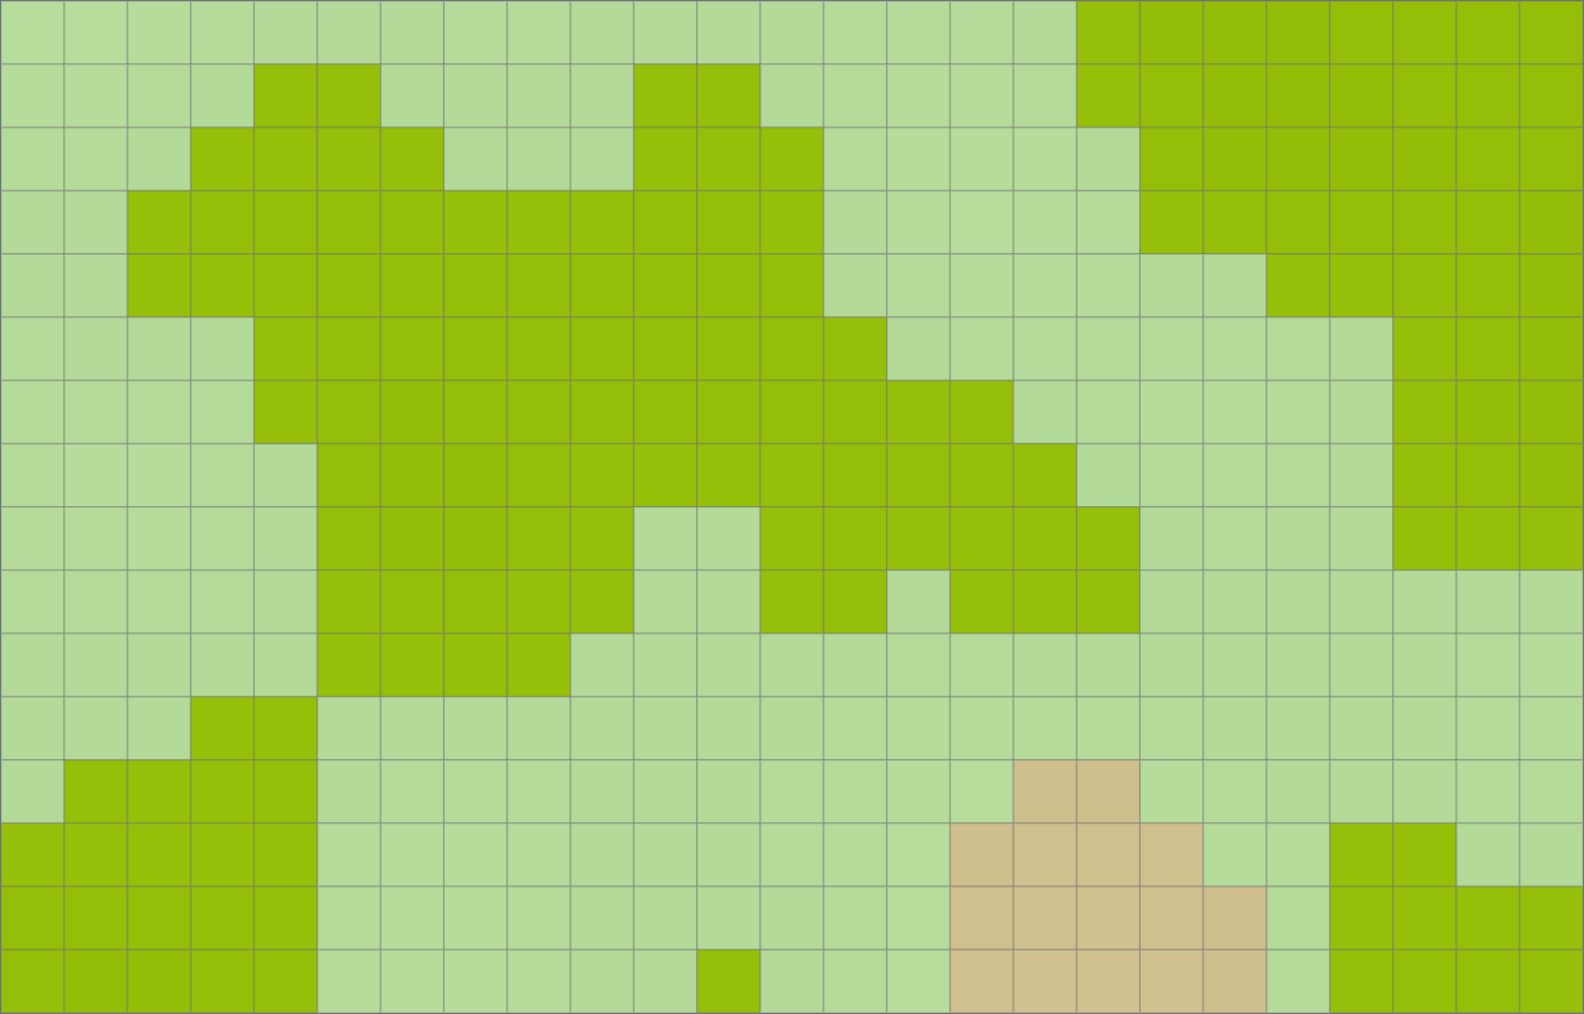
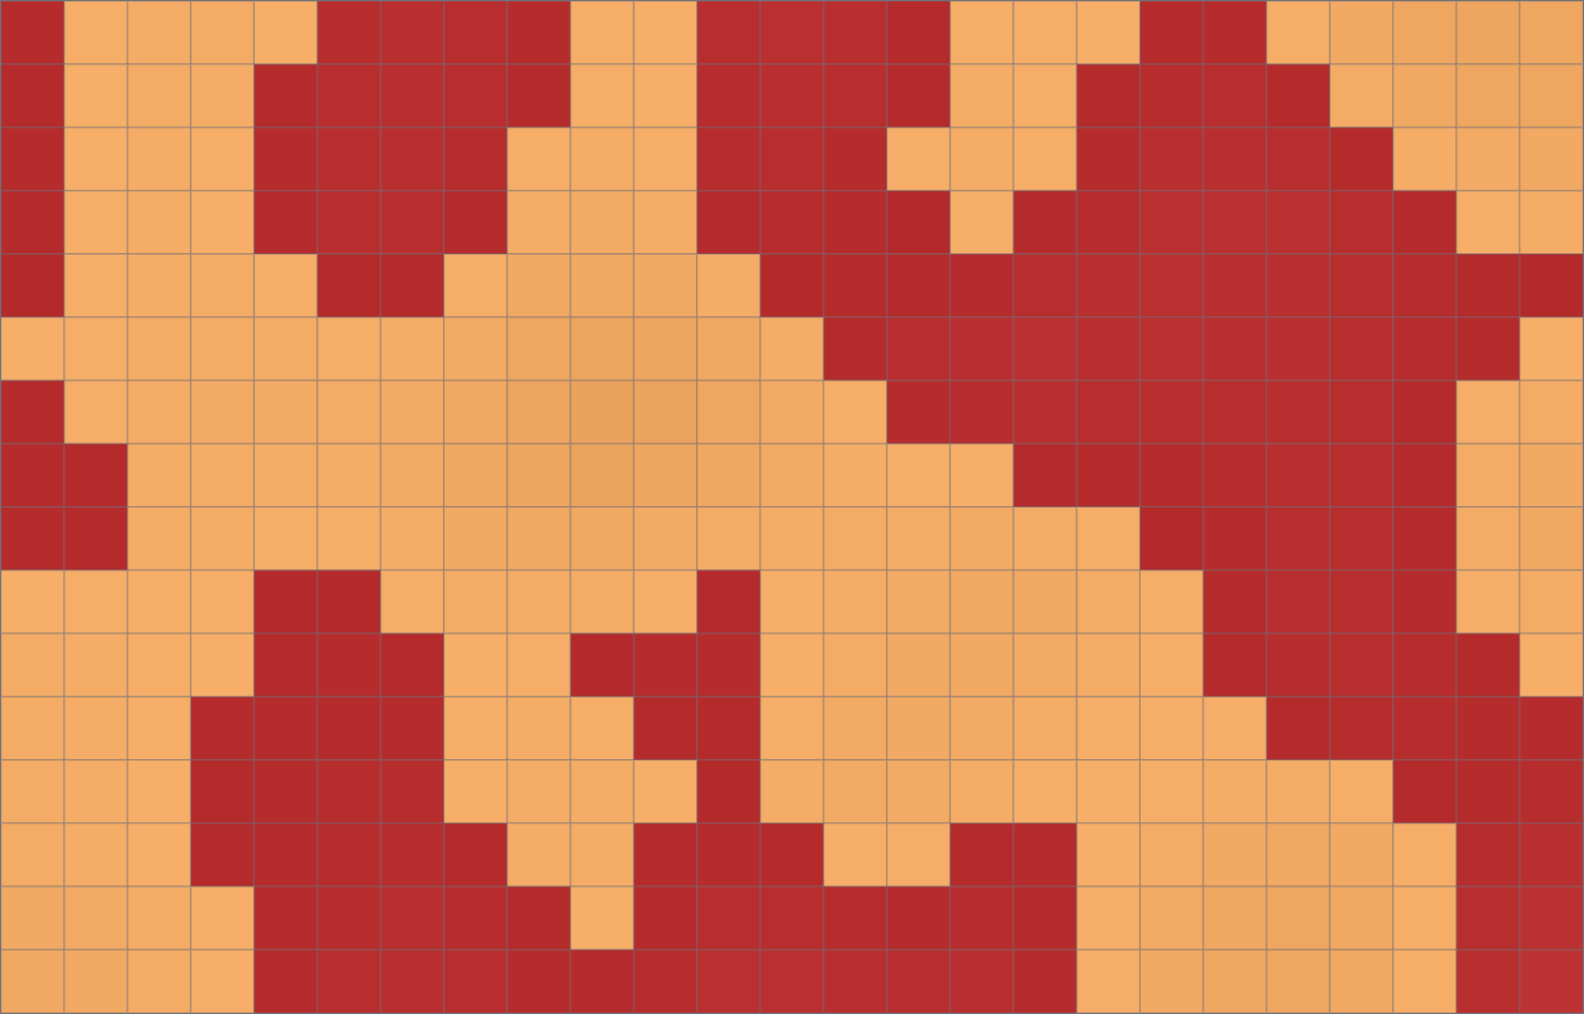
The images below show some of the rendered heightmaps for different biomes.
Grassland:
Desert:
Aquatic:
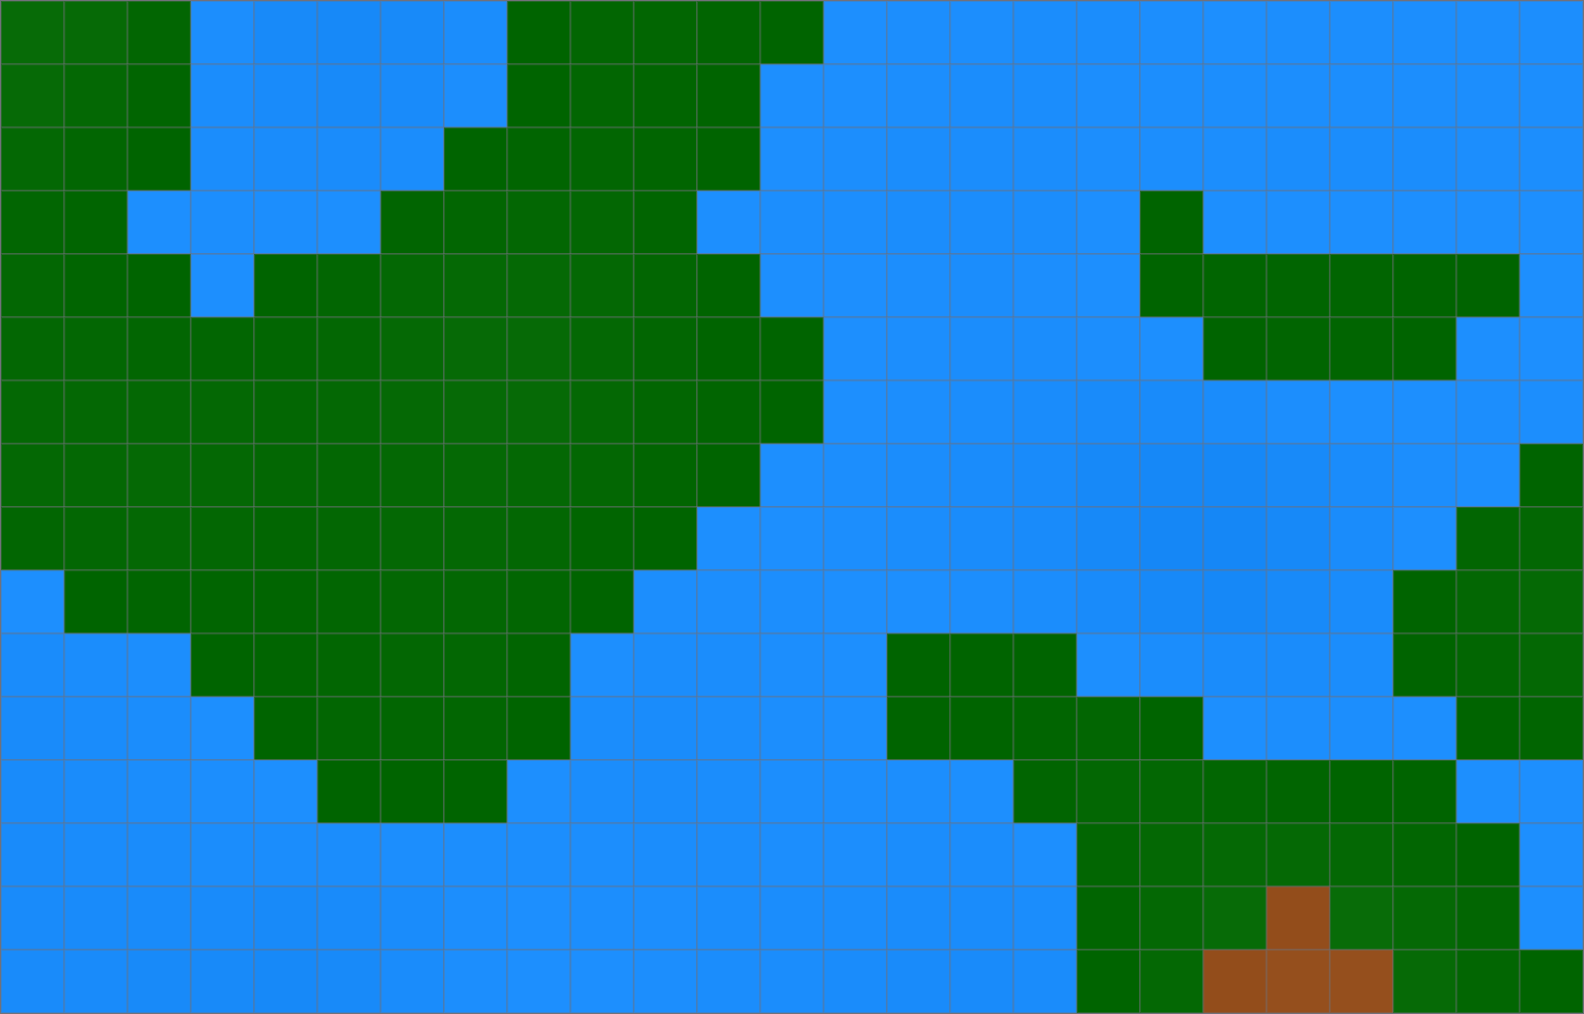
A Complete Battle Map
That’s it. We’ve successfully created a really basic heightmap generation and rendering pipeline tailored to specific biomes. Let’s recap:
We began by defining various biomes and deciding how each influences the terrain’s elevation through our heightmap generator. By selecting a biome, such as forest or desert, we established the foundational height values that characterise the landscape of that region. Recognising that raw heightmaps can produce jagged and unrealistic terrains, we implemented a smoothing algorithm to refine these values. This process ensured that the transitions between different elevations are gradual and natural, resulting in more believable and aesthetically pleasing maps.
Next, we integrated this heightmap data into a Next.js application, leveraging the power of the HTML Canvas to visually represent the terrain. The MapCanvas component rendered each tile based on its height, with a colour scheme that mapped elevations to colours—from deep blues for water bodies to greens for lowlands and whites for snow. This visualisation provides a simple way to analyse the generated terrain.
The culmination of these efforts is a system that generates and displays biome-specific maps, which can be easily adjusted or used as-is for straightforward open-world battles. Next time we’ll expand on this foundation by introducing units that can move and engage in combat with one another.
The next post in this series is currently on hold as I work on updating my blog to support markdown for posts instead of rich text. In the meantime, you can explore the code for this experiment and a few others in my RPG Things GitHub repo.